Introduction
Raw data comes in various formats, which may not be easily digestible to end users to make decisions. This means data needs to be read, analyzed, and presented in an easily understood format. Python has multiple libraries that are used to read, manipulate and present data, with Pandas being among them. Pandas is a Python library that provides high-performance, easy-to-use data structures (Series and Dataframes) and data analysis tools for working with structured (tabular, multidimensional, potentially heterogeneous) data. It is built on top of the NumPy library and is widely used in data science, machine learning, and financial analysis.
Pandas provide various data analysis and manipulation tools like Group by, Data Visualization, Statistical functions, Time series Analysis and Data Reshaping capabilities. This article will discuss the primary method of reshaping data in Pandas called Pivoting.
In this article, we will discuss the following:
- What is Pivoting, and why do you need it?
- How to use Pivot and Pivot Table in Pandas
- When to choose pivot vs. Pivot Table
- Using Melt() in Pandas
What is Pivoting, and why do you need it?
In the context of the Pandas library in Python, pivoting is a neat process that transforms a DataFrame into a new one by converting selected columns into new columns based on their values. This operation is pretty helpful as it allows us to transform a “long” Dataframe into a “wide” one where the unique values of a particular column become the column headers, and the corresponding values in another column fill in the new columns. With this technique, we can make better sense of our data and compare different datasets more efficiently. Pandas has got us covered with some useful functions, such as pivot(), pivot_table(), and melt(), which enable us to set the index, columns, and values to use, as well as to aggregate values with functions like sum, mean, and count.
Let’s deep dive into the Pivoting Methods in Pandas
Before we look at pivoting, let’s generate some data for use in our analysis.
import pandas as pd
import numpy as np

# create a random sample DataFrame
names = ['John', 'Mary', 'Joe', 'Mike', 'Sara', 'Peter', 'Amy', 'Tom', 'Lisa', 'Dan']
subjects = ['Math', 'Science', 'English', 'History', 'Art', 'Music', 'Physical Education', 'Geography']
name_list = []
subject_list = []
grade_list = []
for name in names:
    num_subjects = np.random.randint(4, 9)  # choose a random number of unique subjects between 4 and 8
    subject_choices = np.random.choice(subjects, size=num_subjects, replace=False)  # choose the unique subjects
    for subject in subject_choices:
        grade = np.random.choice(['A', 'B', 'C', 'D', 'F'], p=[0.2, 0.3, 0.3, 0.1, 0.1])  # choose a random grade
        name_list.append(name)
        subject_list.append(subject)
        grade_list.append(grade)
data = {'Name': name_list, 'Subject': subject_list, 'Grade': grade_list}
df = pd.DataFrame(data)

# add a Score column based on the Grade column
def get_score(grade):
    if grade == 'A':
        return np.random.randint(80, 101)
    elif grade == 'B':
        return np.random.randint(70, 80)
    elif grade == 'C':
        return np.random.randint(60, 70)
    elif grade == 'D':
        return np.random.randint(50, 60)
    else:
        return np.random.randint(0, 50)

df['Score'] = df['Grade'].apply(get_score)
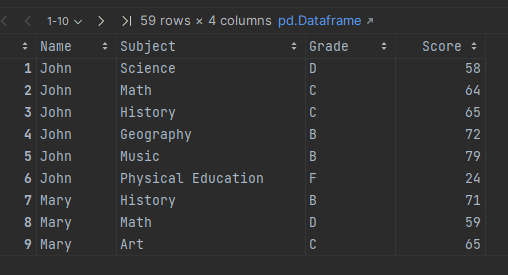
The resultant dataframe looks like the following:
A. Pivot
The pivot() function is an incredibly useful tool for transforming and summarizing data. It allows you to restructure a DataFrame by turning rows into columns and columns into rows based on a specified index column, a specified columns column, and a specified values column. This creates a summary table of the data that is easy to read and analyze.
In our use case, we would like to have the unique subjects as columns, the names as the index, and the grades as the values of the subject columns. This use-case will allow us to compare the names based on subject performance.
pivoted_df = df.pivot(index='Name', columns='Subject', values=['Score'])
print(pivoted_df)
As seen from the code, pivot() takes 3 arguments:
- `index` – This parameter determines the column to use as the index of the new DataFrame, which will be the row labels of the resulting DataFrame.
- `columns` – This parameter specifies the column to use as the column labels of the new DataFrame. Each unique value in this column will become a separate column in the resulting DataFrame.
- `values` – This parameter defines the column to use as the values of the new DataFrame, which will become the cell values of the resulting DataFrame.
Each parameter can be a single value or a list of values.
In the example, we used `Name` as the index, `Subject` as the columns, and `Score` as the values. By doing so, we created a new DataFrame where each row represents a unique person, the columns represent the subjects they took, and the values in the cells represent their scores in those subjects.
B. Pivot Table
The pivot_table() function in pandas is similar to pivot(). However, it is more powerful in that it enables one to create summary tables of data by pivoting on one or more columns and aggregating values across one or more columns. In addition, it provides more flexibility and functionality compared to pivot(), as it allows you to perform more complex operations, such as handling missing values and specifying custom aggregation functions.
To use pivot_table(), you need to specify the DataFrame you want to pivot, the column(s) to use as the index, the column(s) to use as the columns, and the column(s) to use as the values. You can also specify the aggregation function(s) to use on the values column(s) using the aggfunc parameter. This parameter can take in a single function or a dictionary of functions that can be applied to each value column.
The function takes the following parameters:
- data – The first argument is the input DataFrame.
- values – This is the column(s) to aggregate. You can specify a single column as a string or multiple columns as a list of strings.
- index – This is the column(s) to use as the index for the resulting pivot table. You can specify a single column as a string or multiple columns as a list of strings.
- columns – This is the column(s) to use as the columns for the resulting pivot table. You can specify a single column as a string or multiple columns as a list of strings.
- aggfunc – This is the aggregation function(s) used on the values column(s). You can specify a single function as a string, a list of functions, or a dictionary mapping columns to functions.
- fill_value – This is the value for missing values in the resulting pivot table.
- margins – This is a boolean value indicating whether to include row/column totals in the resulting pivot table.
- margins_name – This is the name for the row/column total label(s) if margins are True.
- dropna – This is a boolean value indicating whether to exclude rows or columns with missing values.
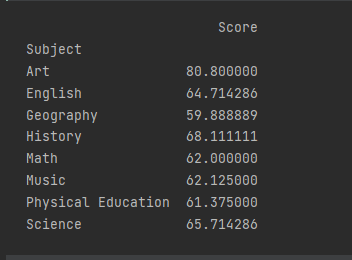
For example, let’s assume we need to calculate the mean score for each subject. This can be accomplished by pivoting the data using the `Subject` as the index, `Score` as the values, and `np.mean` as the aggregation function.
pivoted_df = df.pivot_table(index='Subject', values=['Score'], aggfunc={'Score': np.mean})
print(pivoted_df)
The mean can be omitted as it is the default aggregation function in pivot_table()
pivoted_df = df.pivot_table(index='Subject', values=['Score'])
print(pivoted_df)
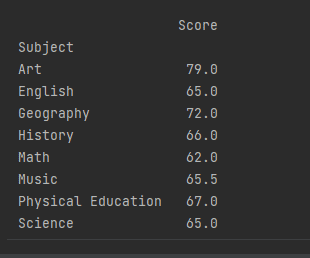
If we need the median value for the score, we can change the `aggfunc` to use `np.median`
pivot_table = pd.pivot_table(df, index=['Subject'], values=['Score'], aggfunc={'Score': np.median})

print(pivot_table)
When to choose Pivot vs. Pivot_Table
If you’re trying to pivot your data and end up with more than one entry in any index + column combination, you’ll need to use the pivot_table() method instead of the regular pivot() method.
On the other hand, if you don’t end up with more than one entry in any index + column combination, you can use the pivot() method. But it’s important to note that you can always switch to pivot_table() if needed, but you can’t do the opposite. Trying to use pivot() when there are multiple entries in any index + column combination will raise a ValueError.
In summary, if you’re unsure whether to use pivot() or pivot_table(), ask yourself whether there will be more than one entry in any index + column combination. If the answer is yes, use pivot_table(). If the answer is no, you can use either pivot() or pivot_table().
Melt()
You have seen the usefulness of the `pivot()` and `pivot_table()` functions in pandas. We have noticed they are crucial for analyzing and visualizing data differently. However, when you need the data in the format it was before pivoting, you can use the `melt()` function.
The melt() function in pandas is a tool for transforming data from wide format to long format. It is useful when working with datasets that have been pivoted or transposed. To use melt(), you specify the DataFrame you want to melt and the column(s) you wish to use as identifier variables, as well as the column(s) you want to unpivot.
For example, let’s say you have a DataFrame containing student names and grades in different subjects and want to transform it from a wide to a long format. You can start by using pivot() to reshape the data into a wide form, as we have done previously.
#Collapse the MultiIndex
pivoted_df.columns = pivoted_df.columns.map(' '.join).str.strip()

#Reset Index to get the Name column back
pivoted_df = pivoted_df.reset_index()

# Melt the pivoted DataFrame
melted_df = pd.melt(pivoted_df, id_vars=['Name'], var_name=['Subject'], value_name='Score')

# rename to remove the collapsed MultiIndex prefix
melted_df.Subject = melted_df.Subject.str.split(' ').str[1]
print(melted_df)
Then we can use melt() to transform it into a long format.
Conclusion
In conclusion, the `pivot()` and `pivot_table()` functions in the Pandas library are powerful functions for reshaping and transforming data. However, pivot() is best used when you have a simple one-to-one relationship between the index and columns of your DataFrame, whereas pivot_table() is more appropriate when you have multiple entries for each combination of index and columns.
With these functions, you can quickly and easily restructure your data to make it more usable and easier to analyze. Moreover, the melt() function can be used in conjunction with pivot() and pivot_table() to transform your data further, allowing you to customize your data analysis and get the insights you need.
We encourage you to experiment with these tools and see how they can help you with your data analysis. As always, we’re here to help you become a better software developer. For any function you write using pandas, you can use our fantastic unit test code completion AI-powered tool, qodo (formerly Codium), available for both Visual Studio Code and JetBrains IDEs.
Please don’t hesitate to reach out if you have any questions.
FAQs
-
What is the difference between Pandas pivot and Pandas pivot_table?
In Python Pandas, both the pivot and pivot_table functions reshape data, but there are some differences. Pivot is used for basic data reshaping without performing aggregations and requires unique index-column combinations. Pivot_table is more versatile and powerful, allowing for advanced data reshaping, including aggregations, handling duplicate values in index-column combinations, and providing options for custom aggregation functions. -
Why do we use pivot_table() in Python?
The Python function pivot_table is used for advanced data reshaping and analysis. It allows for multi-level indexing, handles duplicate values, and offers flexible aggregation options. This function is particularly useful when dealing with complex datasets that require summarization, comparison, or transformation across multiple variables. -
How do you fill in missing values in a Pandas pivot table?
To fill missing values in a Pandas pivot_table function, you can use the fill_value parameter. This argument allows you to specify a value to replace the missing data in the resulting table. For example, setting `fill_value=0` will replace all missing values with zeros, providing a complete dataset. -
How do I create a Pandas pivot table?
To create a Pandas pivot table with Python, you can use either the pivot() or pivot_table() functions. The pivot function is simpler and more suited when you have simple one-to-one relationships between the index and columns. The pivot_table function is more powerful and appropriate when you have multiple entries for each combination of index and column and want to perform aggregations.


