Diagrams as Code (DaC)
As a software developer, I’m sure you must have sketched out some diagrams to understand the system architectures you are dealing with. You may have chosen one of the many tools like draw.io or Canva to draw the diagram. But we all know that drawing lines and boxes is not what we excel at.
That is where Diagram as Code (DaC) comes in as our savior. In this article, we’ll explore the concept of DaC and its benefits and provide examples using popular tools.
What are Diagrams as Code?
Diagrams as Code is a methodology that defines diagrams using a domain-specific language (DSL) or a general-purpose programming language. Specialized tools then process these definitions to generate visual representations. This approach allows developers and architects to create, version, and maintain diagrams using the same workflows they use for code.
Let’s examine what makes DaC unique and why it surpasses traditional diagram drawing.
Benefits of Diagrams as Code
- Version control: Diagrams can be stored in version control systems like Git, allowing easier tracking of changes over time.
- Better collaboration: Team developers can work together even on the same diagrams, and changes can be easily merged and reviewed.
- Higher consistency: Programmatic creation of diagrams ensures consistent styling and formatting.
- Automation: Diagram generation can be integrated into CI/CD pipelines, allowing for seamless diagram updates.
- Maintainability: Large and complex diagrams can be managed more easily through code.
Popular Tools for Diagrams as Code
1. Mermaid
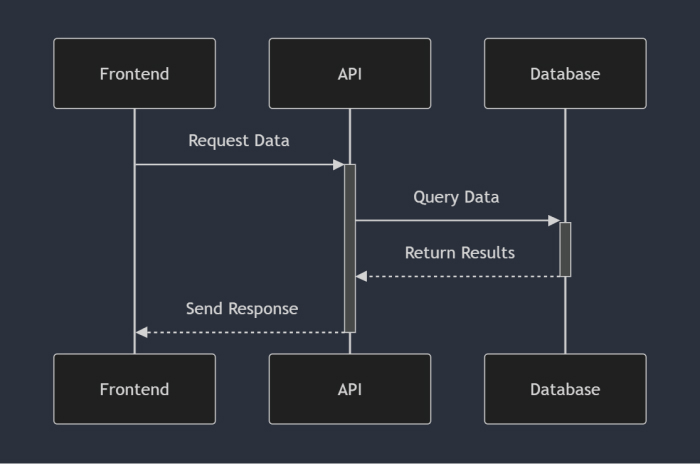
Mermaid is an efficient open-source JavaScript-based diagramming tool that allows you to create diagrams using a simple markdown-like syntax. Mermaid has a live editor where you can test out and generate your diagrams using code, and many great examples are available for different types of diagrams.
Below is an example sequence diagram created using Mermaid code.
sequenceDiagram
    participant Frontend
    participant API
    participant Database

    Frontend->>+API: Request Data
    API->>+Database: Query Data
    Database-->>-API: Return Results
    API-->>-Frontend: Send Response
In markdown-supporting apps like GitHub and GitLab, you can push changes, and the diagrams are rendered automatically. If you keep your project documentation on Github, this can be a huge time saver.
In static site generators or custom documentation systems, you can use the Mermaid Cli tool to convert Mermaid code into diagrams. Mermaid can also be integrated into your codebase using their JavaScript API.
2. PlantUML
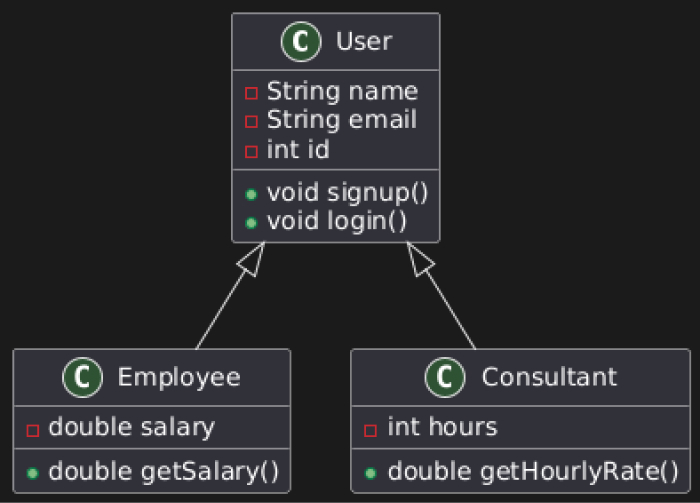
If you prefer to generate diagrams using a simple, plain text-like language, PlantUML is the tool for the job. PlantUML has numerous types of diagrams, both UML and non-UML that can be customized in many ways. They provide a variety of custom styling options and a set of custom themes. PlantUML also has an online server where you can create and download graphs.
Let’s look at an example class diagram created using PlantUML.
@startuml
class User {
- String name
- String email
- int id
+ void signup()
+ void login()
}

class Employee {
- double salary
+ double getSalary()
}

class Consultant {
- int hours
+ double getHourlyRate()
}

User <|-- Employee
User <|-- Consultant
@enduml
PlantUML can be integrated into various IDEs and documentation tools. Plant UML’s command-line interface, as well as Gradle and Maven plugins, can be used to automate diagram generation.
3. Diagrams – Mingrammer
Diagrams is a library that allows you to create cloud system architecture diagrams using Python code. It is perfect for drawing architecture diagrams for Cloud systems like AWS, Azure, and GCP. Diagrams does not have an online editor; therefore, you would have to set it up locally. However, setting it up is very simple; you only need to install Python 3.7 or higher and Graphviz.
Let’s see an example of an AWS Architecture diagram created using Diagrams.
from diagrams import Diagram, Cluster
from diagrams.aws.compute import EC2
from diagrams.aws.database import RDS
from diagrams.aws.network import ELB
from diagrams.aws.network import Route53
from diagrams.aws.storage import S3

with Diagram("Web Application Architecture", show=False):
  dns = Route53("Route 53")
  lb = ELB("Elastic Load Balancer")

  with Cluster("Auto Scaling Group"):
    web = [EC2("Web Server 1"),
          EC2("Web Server 2"),
          EC2("Web Server 3")]
  db = RDS("RDS Database")
  storage = S3("S3 Bucket")

  dns >> lb >> web
  web >> db
  web >> storage
When this code is executed, a PNG file named ‘web_application_architecture’ will be created within the same directory. You can automate the architecture diagram generation process by writing a Python script and adding it to the project’s CI/CD pipeline.
Conclusion
To summarize, Diagram as Code is a revolutionary approach for drawing diagrams using a more familiar format for developers. It enables many benefits that you would not just get by traditionally drawing diagrams. Incorporating DaC tools into your development process makes it possible to integrate the acquired diagrams with the latest updates in terms of the code or infrastructure. You can also apply it together with Documentation as Code to fully automate the document generation process of your project.


