How do you performance test JavaScript code?

Just like Python and R has become the go-to programming languages for Artificial Intelligence and Machine learning, JavaScript has become the most used language for the web, especially front-end development and backend development. It enables the creation of everything from simple websites to complex applications, making it essential for developers to learn.
With this wide usage on the web, JavaScript requires robust testing to check for performance bottlenecks. Performance testing in JavaScript refers to the process of assessing and evaluating the efficiency, security, speed, and scalability of JavaScript code or JavaScript-based web applications. The primary goal is to identify any bottlenecks, performance issues, or areas of improvement to ensure optimal user experience and application functionality.
Performance testing in JavaScript is multifaceted and involves different testing strategies for different testing types.
Types of JavaScript Performance Testing
1. Stress Testing
In this type of testing, the system is put under a load that exceeds the system and the project’s expected capacity. It is used to evaluate the code behavior under these extreme conditions to identify the breaking point and observe how the code and system recover from failure. This type of performance testing involves identifying stress conditions, developing test scenarios that expose the code to extreme conditions, running the tests, and analyze the results. These performance testing creates measures for various metrics, including system limits, breakpoints, time to failure, and recovery time.
2. Load Testing
In this type of testing, the performance of the code and system are evaluated under expected load conditions, usually over an extended period of time. This will evaluate the performance of anticipated traffic and interactions to create values for various metrics like response times, throughput, error rates, and resource utilization.
3. Responsiveness Testing
This critical performance testing process aims to ensure that the application or website works correctly and efficiently across various platforms, screen sizes, orientations, and devices. It measures how fast the application responds to user interactions so as to enhance user experience. This testing creates metrics of evaluation, including load times on various devices, browsers, and screen sizes, render time, interaction delays, and visual consistency.
4. Scalability Testing
This performance testing subtype is closely related to load testing and focuses on evaluating the capability of the JavaScript application to handle growth in traffic in terms of users, data sizes, and interaction volumes. It hence, measures the application’s ability to scale up and down to handle increasing and decreasing demands.
Tools Used for Performance Testing of JavaScript Code
Each of the mentioned performance testing scenarios requires different testing tools to analyze the overall application.
1. Inbuilt JavaScript Utilities
JavaScript has built-in methods that can be used to assess the performance of your code through console logs and can even be used to write to an actual log file. The main utilities and methods include performance.now(), console.timeEnd() and console.time(). When working with a large code base, it is usually difficult to identify which parts of the code are causing performance issues. These utilities come in handy as they can measure the time it takes for specific functions or sections of code to execute and compare the results to identify improvement areas. Additionally, these utilities can be used to track the performance of your code over time, allowing you to monitor any changes in performance and identify any issues that may occur as you make changes to your code.
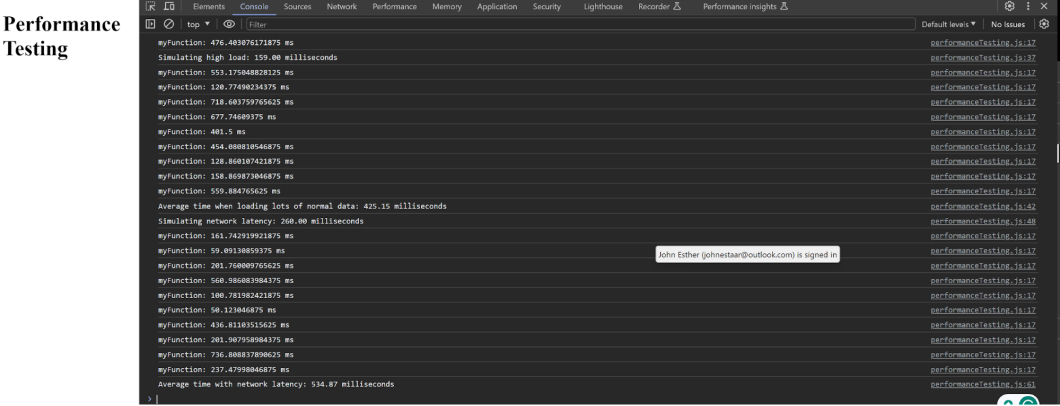
Consider the following code where network latency and high load are simulated to perform load, stress, and scalability testing and report the metrics using these utilities. It will report the time it takes to get results when simulating load and network latency.
function myFunction() {
    // start the timer
    console.time("myFunction");

    // do some heavy computation
    let sum = 0;
    for (let i = 0; i < 1000000; i++) {
        sum += i;
    }

    // simulate network latency
    let latency = Math.floor(Math.random() * 1000);
    let startLatency = performance.now();
    while (performance.now() - startLatency < latency) {}

    // stop the timer and log the elapsed time
    console.timeEnd("myFunction");

    // return the result
    return sum;
}

// call the function multiple times and log the average elapsed time
let totalTime = 0;
let numIterations = 10;
for (let i = 0; i < numIterations; i++) {
    let startTime = performance.now();
    myFunction();
    let endTime = performance.now();
    totalTime += endTime - startTime;

    // simulate high load
    if (i % 100 === 0) {
        let loadTime = Math.floor(Math.random() * 1000);
        let startLoad = performance.now();
        while (performance.now() - startLoad < loadTime) {}
        console.log(`Simulating high load: ${loadTime.toFixed(2)} milliseconds`);
    }
}

let averageTime = totalTime / numIterations;
console.log(`Average time when loading lots of normal data: ${averageTime.toFixed(2)} milliseconds`);

// simulate network latency
let latency = Math.floor(Math.random() * 1000);
let startLatency = performance.now();
while (performance.now() - startLatency < latency) {}
console.log(`Simulating network latency: ${latency.toFixed(2)} milliseconds`);

// call the function multiple times and log the average elapsed time with network latency
totalTime = 0;
numIterations = 10;
for (let i = 0; i < numIterations; i++) {
    let startTime = performance.now();
    myFunction();
    let endTime = performance.now();
    totalTime += endTime - startTime + latency;
}

averageTime = totalTime / numIterations;
console.log(`Average time with network latency: ${averageTime.toFixed(2)} milliseconds`);
The results from running this code are attached in the following graphic:
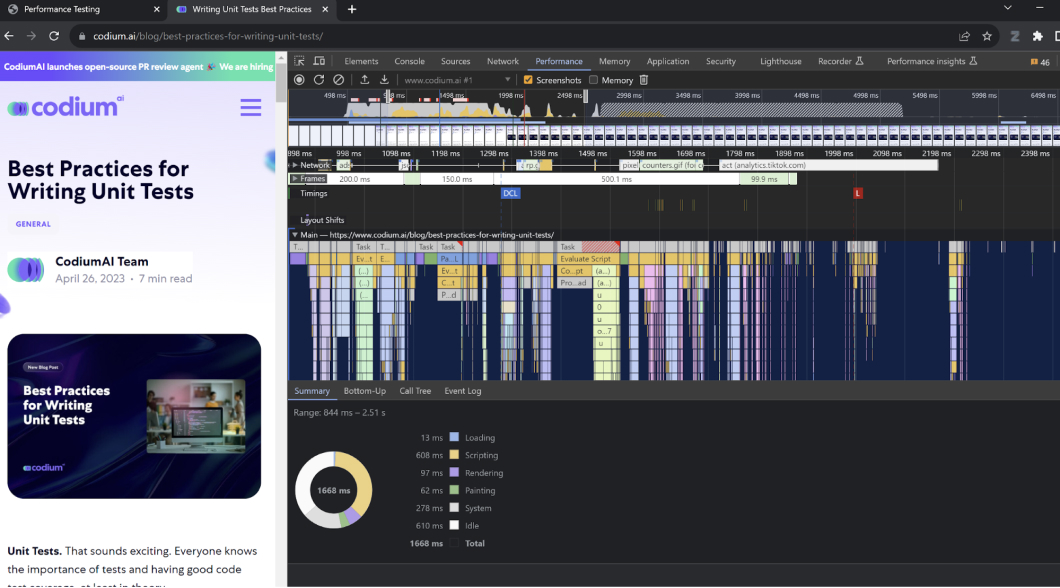
2. Browser Developer Tools
Most browsers today come with inbuilt Performance Testing modules for JavaScript, HTML, and CSS. Chrome DevTools, Firefox Developer Tools, and other browser-based tools allow developers to profile and debug JavaScript code, measure runtime, and identify bottlenecks in real-time. For example, the following graphics show performance testing for a blog post using Chrome Developer Tools.
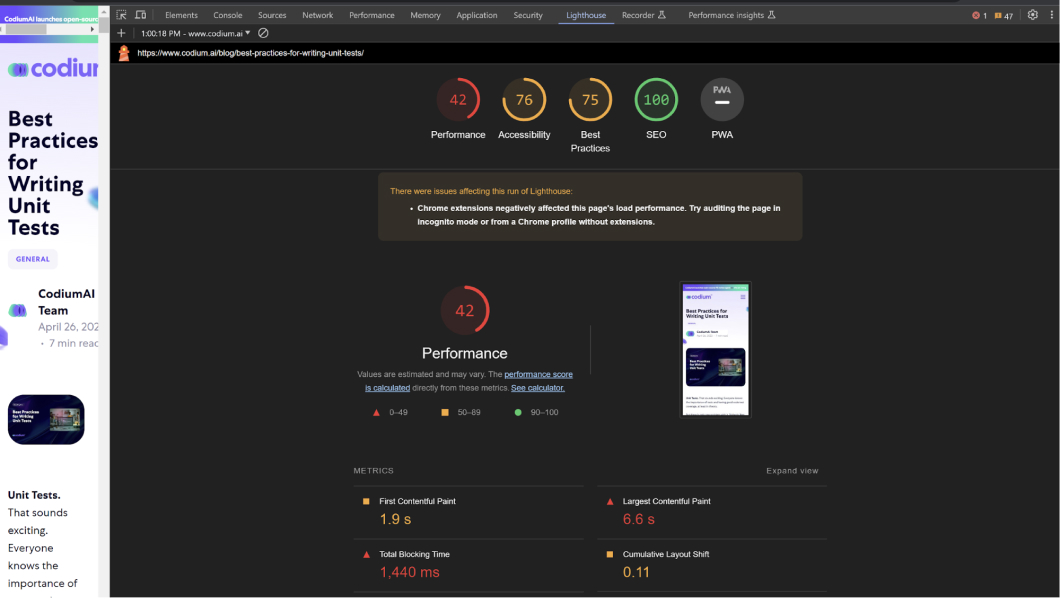
3. Lighthouse
Closely related to DevTools is the lighthouse module, which can be accessed via Chrome DevTools, command line, WebUI, and NodeJS. Lighthouse is a free, open-source tool designed to enhance the quality of web pages by providing automated evaluations. It gets executed on any web page, whether it’s publicly accessible or requires login credentials. Lighthouse conducts assessments in several areas: performance, accessibility, progressive web apps (PWAs), and search engine optimization (SEO). Each audit has a reference doc explaining why it is important and how to fix it.
Other Third-party Applications and Frameworks
JavaScript has other third-party models and frameworks that can be used for performance testing. The list is long and keeps changing as the JavaScript ecosystem evolves. Some of the most notable tools include; Jmeter, LoadRunner, Gatling, Load Views, Artillery, Jest, Mocha, and k6.
Conclusion
In conclusion, Performance Testing in Javascript can be done using various methods, including builtin methods, browser tools, and other specialized third-party tools. Though the list above is not exhaustive, it gives a base on which to build the good habit of including and using performance testing tools when writing JavaScript code.